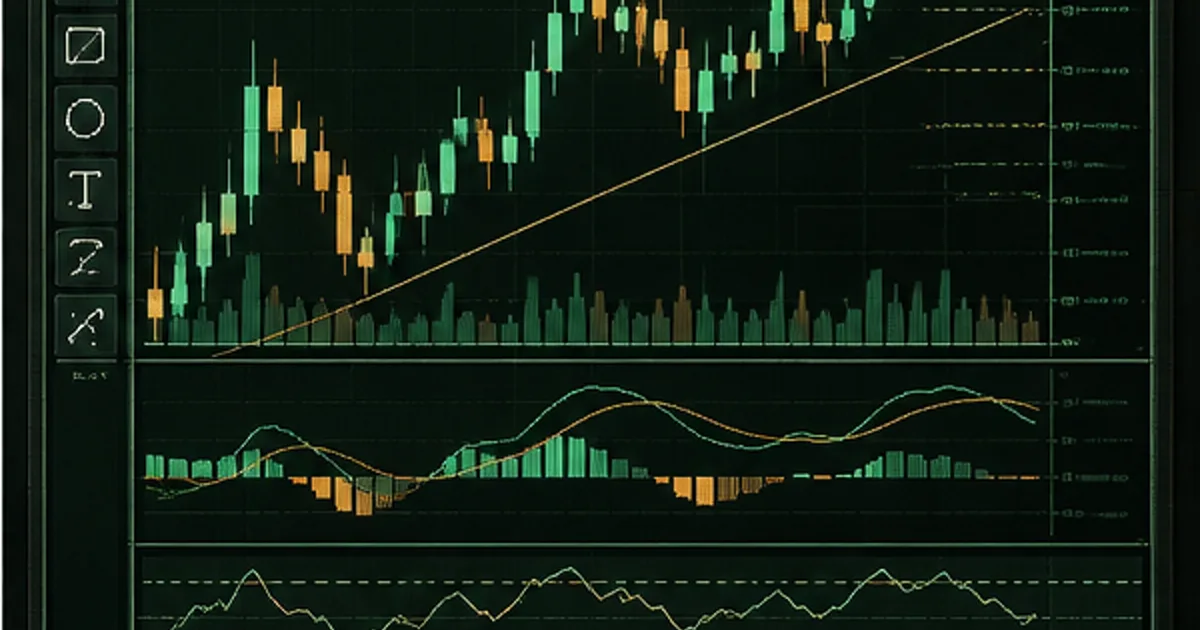
Price is the starting point
A chart compresses transactions into bars or candles showing open, high, low and close for a period. The chosen period changes what is visible. A pattern on a five-minute chart may be insignificant within a daily trend.
Technical analysis works best as structured observation: what is rising, falling, ranging or changing? Language such as “if this level holds” is more honest than declaring that a line predicts the future.
Trend, support and resistance
An uptrend is commonly described by higher swing highs and higher swing lows; a downtrend reverses that structure. Support and resistance are zones where prior activity may influence decisions, not invisible walls that price must obey.
Levels become more useful when linked to a clear plan: where is the idea invalid, how much can be lost, and what would prevent entry? Drawing more lines does not necessarily create more information.
Indicators are transformations
Moving averages, oscillators and volatility bands transform existing price data. They can standardize observations but do not add knowledge of the future. Similar indicators may duplicate the same information and create false confidence through agreement.
Volume can provide context, though its meaning depends on the market and data source. Centralized exchange volume differs from decentralized forex tick activity. Verify what a platform actually displays.
- Trend tools describe direction
- Momentum tools describe rate of change
- Volatility tools describe dispersion
- Volume tools describe recorded activity
Multiple timeframes and confirmation
A broader timeframe can establish context while a narrower one refines execution. This should be defined before analysis; switching timeframes until a preferred answer appears is a form of confirmation bias.
Confirmation should mean independent evidence, not several formulas derived from the same closing prices. Even strong alignment can fail, so every chart plan still requires an invalidation point.
Charting-platform questions
When assessing Aptus Trade or another platform, ask which data source supplies each chart, whether timestamps and sessions can be adjusted, how corporate actions are handled, and whether drawings persist reliably. Compare the chart with the executable order ticket during active conditions.
A polished chart does not verify the platform operator or execution quality. Use the Aptus Trade review and platform-mechanics guide for the legal and operational layers.
Key takeaway
Technical analysis is a vocabulary for organizing uncertain information. Keep charts clean, define interpretations in advance, and track whether a method adds decision value after costs.
Combine chart reading with volatility and risk management. A setup without position sizing is incomplete.